Cold storage has no rent index.
Its power bill does.
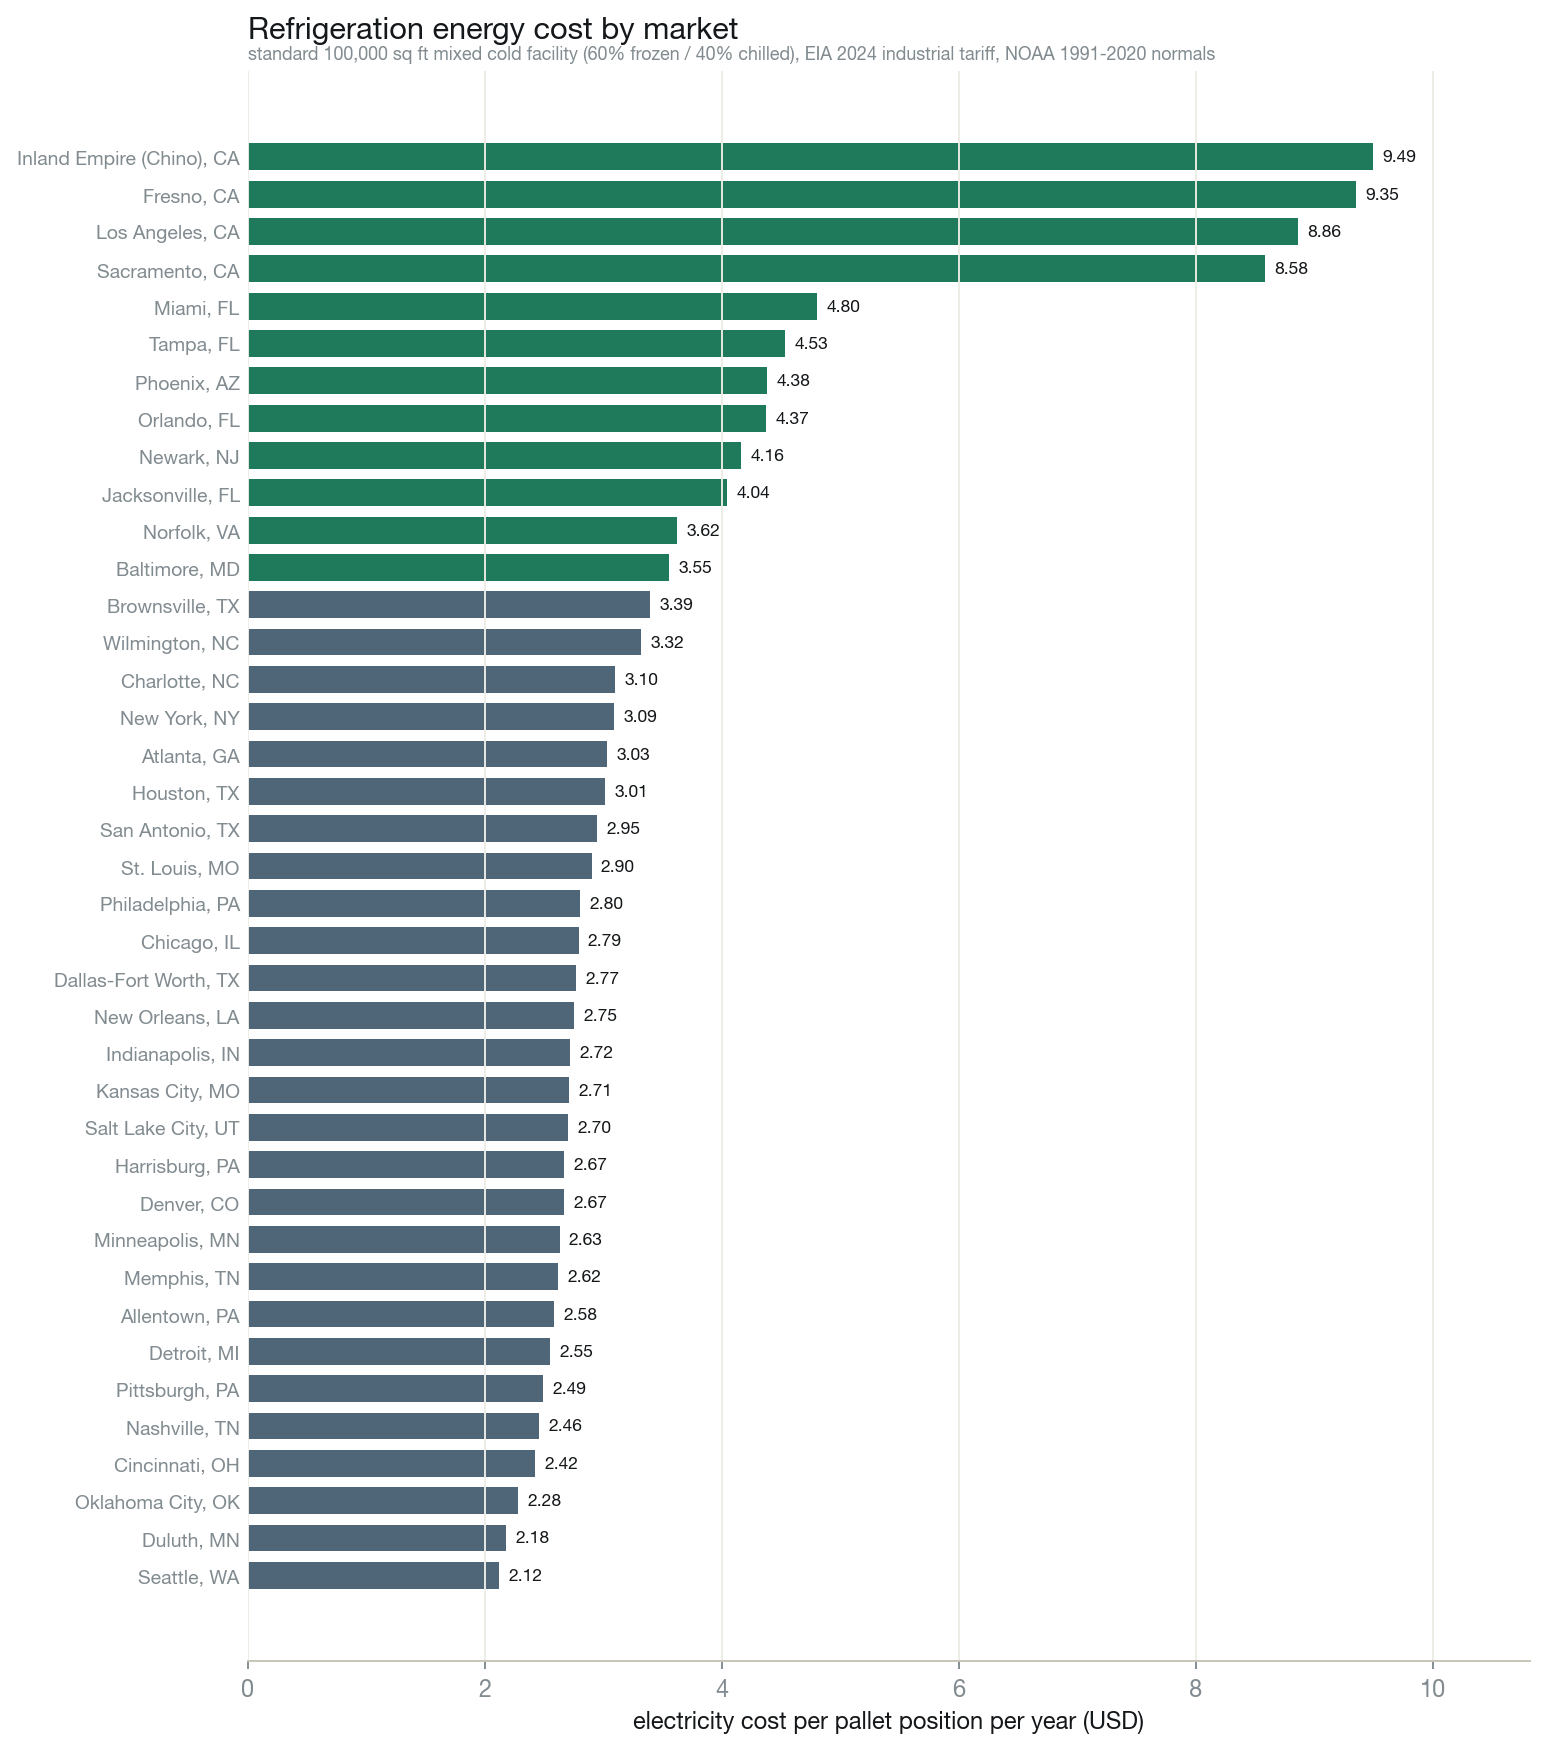
Refrigeration energy and electricity cost per pallet position, per year, for 39 US cold-storage markets — modelled from public utility, climate and capacity data. Built for owners, buyers, lenders and appraisers who have to put a number on a cold facility.
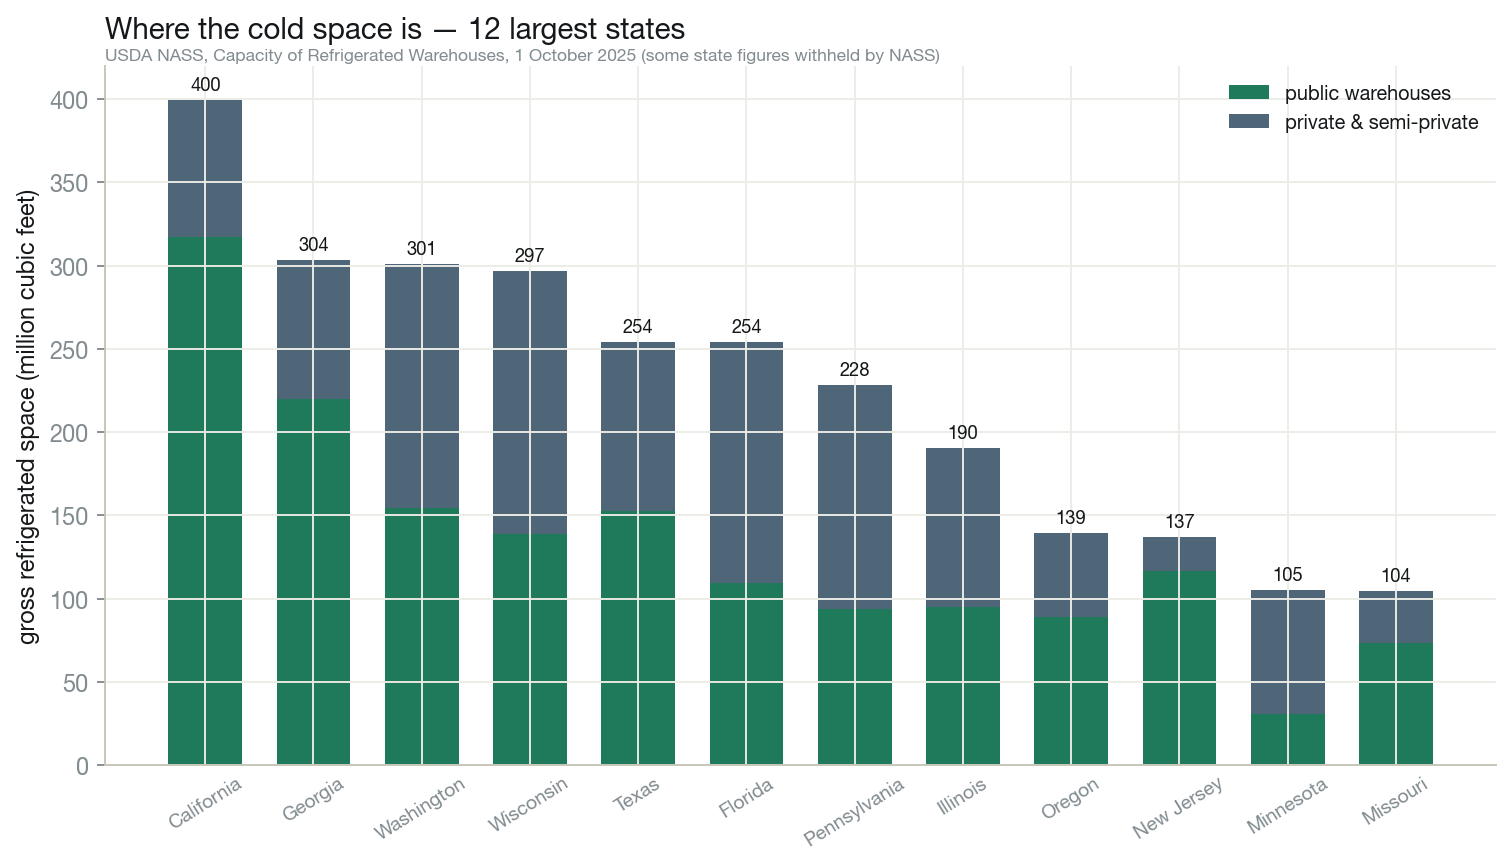
This is institutional money: Lineage turned over $5.36 bn and Americold $2.54 bn in FY2025 (both SEC filers), against 3.99 bn ft³ of US refrigerated space (USDA NASS). Both underwrite energy per pallet by hand. Neither publishes a market-by-market index of it.
The index — 39 markets
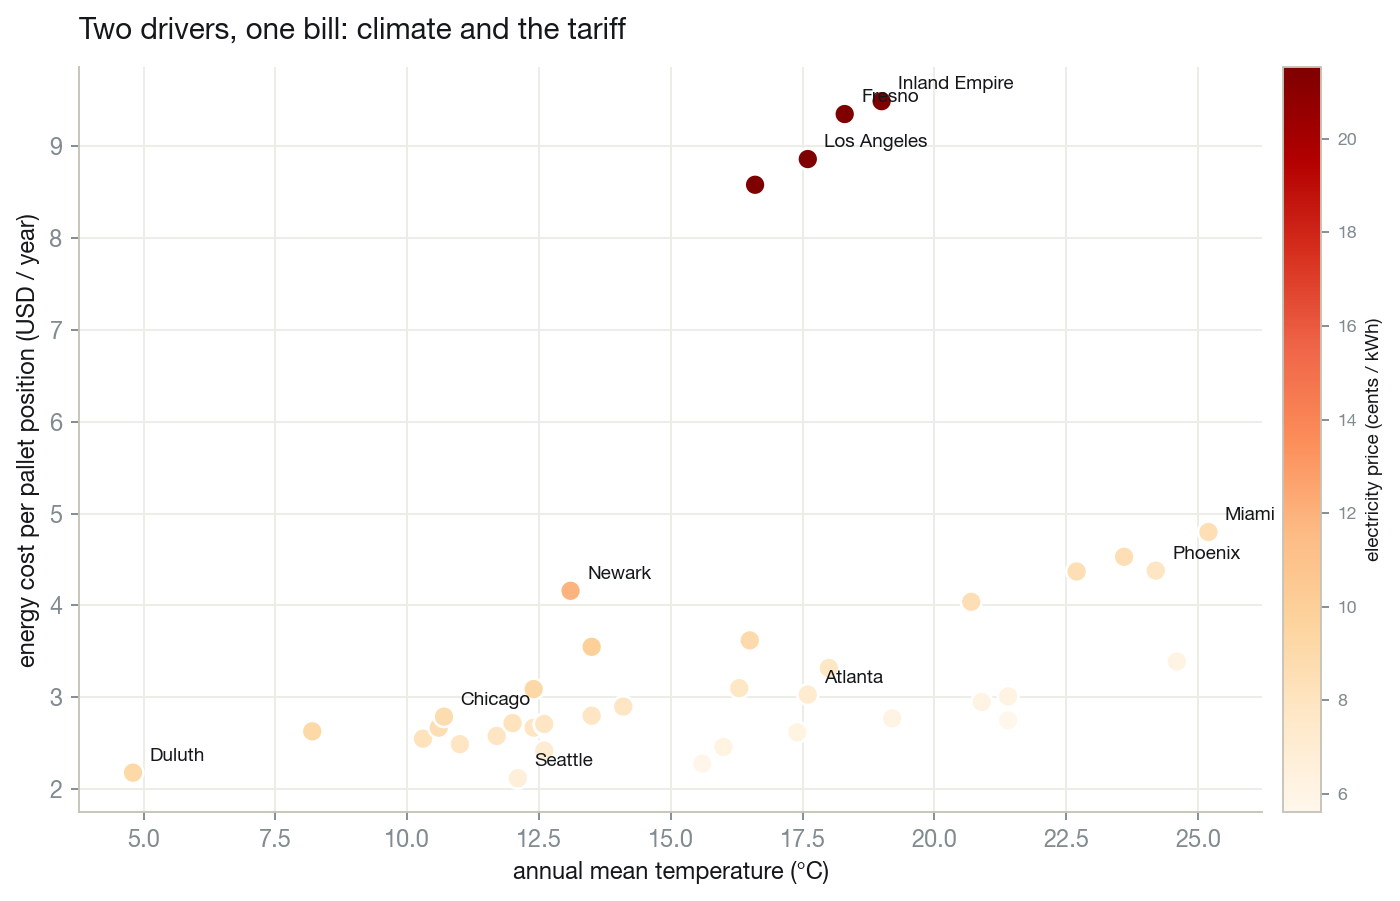
One standard facility: 100,000 sq ft, 11 m clear, 22,000 pallet positions, 60% frozen at −18 °C and 40% chilled at +2 °C, 150 mm panels, electric defrost. Same building everywhere — only the climate and the tariff change. Costs use the 2024 EIA state industrial tariff.
| Market | State | Mean temp | kWh/m²·yr | kWh/pallet·yr | Power | $/pallet·yr | $/yr |
|---|---|---|---|---|---|---|---|
| Inland Empire (Chino) | CA | 19.0°C | 104 | 44 | 21.5¢ | $9.49 | $209k |
| Fresno | CA | 18.3°C | 103 | 43 | 21.5¢ | $9.35 | $206k |
| Los Angeles | CA | 17.6°C | 98 | 41 | 21.5¢ | $8.86 | $195k |
| Sacramento | CA | 16.6°C | 94 | 40 | 21.5¢ | $8.58 | $189k |
| Miami | FL | 25.2°C | 134 | 56 | 8.5¢ | $4.80 | $106k |
| Tampa | FL | 23.6°C | 126 | 53 | 8.5¢ | $4.53 | $100k |
| Phoenix | AZ | 24.2°C | 131 | 56 | 7.9¢ | $4.38 | $96k |
| Orlando | FL | 22.7°C | 122 | 52 | 8.5¢ | $4.37 | $96k |
| Newark | NJ | 13.1°C | 82 | 35 | 11.9¢ | $4.16 | $91k |
| Jacksonville | FL | 20.7°C | 113 | 48 | 8.5¢ | $4.04 | $89k |
| Norfolk | VA | 16.5°C | 95 | 40 | 9.0¢ | $3.62 | $80k |
| Baltimore | MD | 13.5°C | 84 | 35 | 10.0¢ | $3.55 | $78k |
| Brownsville | TX | 24.6°C | 131 | 55 | 6.1¢ | $3.39 | $75k |
| Wilmington | NC | 18.0°C | 101 | 43 | 7.8¢ | $3.32 | $73k |
| Charlotte | NC | 16.3°C | 95 | 40 | 7.8¢ | $3.10 | $68k |
| New York | NY | 12.4°C | 80 | 34 | 9.2¢ | $3.09 | $68k |
| Atlanta | GA | 17.6°C | 100 | 42 | 7.2¢ | $3.03 | $67k |
| Houston | TX | 21.4°C | 116 | 49 | 6.1¢ | $3.01 | $66k |
| San Antonio | TX | 20.9°C | 114 | 48 | 6.1¢ | $2.95 | $65k |
| St. Louis | MO | 14.1°C | 87 | 37 | 7.9¢ | $2.90 | $64k |
| Philadelphia | PA | 13.5°C | 84 | 36 | 7.9¢ | $2.80 | $62k |
| Chicago | IL | 10.7°C | 75 | 32 | 8.8¢ | $2.79 | $61k |
| Dallas-Fort Worth | TX | 19.2°C | 107 | 45 | 6.1¢ | $2.77 | $61k |
| New Orleans | LA | 21.4°C | 116 | 49 | 5.6¢ | $2.75 | $61k |
| Indianapolis | IN | 12.0°C | 79 | 33 | 8.2¢ | $2.72 | $60k |
| Kansas City | MO | 12.6°C | 82 | 34 | 7.9¢ | $2.71 | $60k |
| Salt Lake City | UT | 12.6°C | 81 | 34 | 7.9¢ | $2.70 | $59k |
| Denver | CO | 10.6°C | 74 | 31 | 8.6¢ | $2.67 | $59k |
| Harrisburg | PA | 12.4°C | 80 | 34 | 7.9¢ | $2.67 | $59k |
| Minneapolis | MN | 8.2°C | 68 | 29 | 9.2¢ | $2.63 | $58k |
| Memphis | TN | 17.4°C | 100 | 42 | 6.2¢ | $2.62 | $58k |
| Allentown | PA | 11.7°C | 78 | 33 | 7.9¢ | $2.58 | $57k |
| Detroit | MI | 10.3°C | 73 | 31 | 8.3¢ | $2.55 | $56k |
| Pittsburgh | PA | 11.0°C | 75 | 32 | 7.9¢ | $2.49 | $55k |
| Nashville | TN | 16.0°C | 94 | 40 | 6.2¢ | $2.46 | $54k |
| Cincinnati | OH | 12.6°C | 81 | 34 | 7.1¢ | $2.42 | $53k |
| Oklahoma City | OK | 15.6°C | 92 | 39 | 5.8¢ | $2.28 | $50k |
| Duluth | MN | 4.8°C | 56 | 24 | 9.2¢ | $2.18 | $48k |
| Seattle | WA | 12.1°C | 76 | 32 | 6.6¢ | $2.12 | $47k |
Read it as a band, not a verdict: your building's insulation, dock activity, setpoints and tariff rider will move it. The paid report puts your actual numbers against this band.
What you can buy
Metro Report — one market
- Your facility measured against the market band, line by line, with the assumptions shown
- Tariff analysis: what your state's industrial rate costs versus neighbouring markets
- Sensitivity table: setpoint, dock activity, panel upgrade, defrost — what each is worth per year
- Climate-adjusted forward view using NOAA normals, not a single year
- Delivered in 5 business days, as a PDF you can hand to a lender or an appraiser
Index subscription
- The full 39-market table, refreshed every quarter
- New markets added as data lands
- Change log: what moved and why (tariff, climate, capacity)
- The same model, re-runnable — assumptions published, not hidden
Straight talk. This is an engineering model on public data, not a utility bill. It answers "what should this building cost to run here", not "what did you pay last year".
Data: EIA Electric Sales & Revenue 2024 (state industrial tariff), NOAA NCEI 1991–2020 monthly normals (airport stations), USDA NASS Capacity of Refrigerated Warehouses 2025 (capacity) and Cold Storage (stocks). Where NASS withholds a state figure, the table says so.
Full method, constants and code: available with the report. Payments are processed by
Stripe; the charge appears as COLDSTORE on your statement.
Questions: r7adco@gmail.com.